
We have seen the power of simple predictions during our exercise for the football #EURO2020 results prediction game. The simple ArtiBots have predicted the final scores of all matches better than 99.8% of human gamers. You can find more details in this Artifact Insights Blog: https://insights.artifact.swiss/2021/07/why-simple-robots-better-than-humans-predicting-football/
We now thought we would want to reload the sports results prediction experience with one of the most precious events conducted, the Olympic Games in Tokyo. As such we aim to predict the final medal table as of the 9. August once all competitions and Gold Medal decisions have been made for history.
In order do so, I followed the widely used data science methodology CRISP-DM (see: https://en.wikipedia.org/wiki/Cross-industry_standard_process_for_data_mining):
- I’ve started to analyze the medal table, the different competitions, the way the medals were awarded (e.g., I did not know that there are more than 50 competitions where 2 Bronze Medals are given), special effects such as doping scandals, new competitions, and now as well COVID-19 implications.
- With this business understanding I’ve assessed potential data sources from where to obtain the necessary information. I’ve scraped the historic medal tables back to 2000 and the all-time medal table and other inputs, like the competitions, the new disciplines, and the past doping cases from the official IOC site but also from sports magazine and finally Wikipedia.
- I’ve then stared to prepare the data to either operationalize the information (e.g., on new competitions and doping cases by country) and to harmonize the information (e.g., different country names and formats)
- Once I’ve reached a conform data layer where all information could be analyzed smoothly, I’ve started to run some basic analysis to understand the average, mean, trend, and seasonality / special effects of the data. Based on the modelling, I’ve started to understand how the data across years is connected and was able to define weighting factors for the regression analysis. Before defining the final weightings, I’ve experimented the effects of different factors and have tried to predict previous medal tables (aka A/B testing). In general, the more recent Olympic games should have a much higher weighting factor than the games long ago. E.g., I’ve weighted the 2016 (the last Summer Olympic games) with a factor 13 while the all-time Olympic medal table was rated with a factor of 3 and the 2000 medal table only with a factor of 1. For the geeks among us despite the bottom-up analysis – the weighting factors have turned out to follow the Fibonacci number (see more here: https://en.wikipedia.org/wiki/Fibonacci_number)
- With this initial prediction, I then started to iterate the process and included additional data sets, such as the new competitions, potential tied decision (where 2 Silver Medals are given as the athletes had the same results) and other impacting factors to better model the reality.
- Bringing it all together, I’ve then applied the prediction model to the past data to predict the #TOKYO2020 Olympic games Gold, Silver & Bronze Medals by country. The results can be observed in the table below – of course I’ve added Switzerland to the Top 10 countries. (The full table can be access at the end of this blog)
| Rank | Country | 🥇 Gold Medals | 🥈 Silver Medals | 🥉 Bronze Medals | Total Medals |
| 1 | USA | 55 | 42 | 42 | 139 |
| 2 | China | 34 | 22 | 24 | 80 |
| 3 | Great Britain | 26 | 21 | 20 | 67 |
| 4 | Russia | 22 | 19 | 25 | 66 |
| 5 | Germany | 20 | 18 | 21 | 59 |
| 6 | France | 12 | 17 | 17 | 46 |
| 7 | Japan | 12 | 11 | 18 | 41 |
| 8 | Australia | 11 | 15 | 14 | 40 |
| 9 | Italy | 11 | 12 | 11 | 34 |
| 10 | South Korea | 11 | 7 | 9 | 27 |
| 26 | Switzerland | 3 | 3 | 3 | 9 |
Knowing that this is not a perfect prediction – but we are curious whether this quite straight forward Data Science approach will yield as good results as the #EURO2020 ArtiBots. Interesting, that the algorithm sees USA leading the medal table. Switzerland is performing better than generally expected (goal of 7 medals has been communicated). Overall, there will be 75 nations winning at least one of the predicted 1071 awarded medals across Gold, Silver & Bronze.
We are curious to measure our performance on the 9. August, after the XXXII Olympic Games are closed.
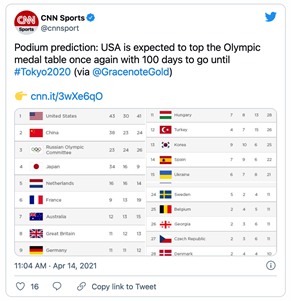
To bridge the time, we can already now start to compare our predictions with the one e.g., from @CNNSport – see http://cnn.it/3wXe6qO and @GracenoteGold. We can see that our forecast of the medal distribution sees about 10% more medals for the US team while we are similar for China. Interesting is that we predict much more medals for the British team as we see them on 3rd rank with 67 medals, CNN shared that Great Britain would end up 8th with only 36 medals.
What is your assessment of these initial predictions? Do you believe in the 9 medals the Swiss team “should” win? What is your view on Russia and Great Britain? Do you think the US team will dominate the Tokyo games? Happy to discuss!
Tokyo 2020 Olympic Games Medal Table Prediction
| Rank | Country | 🥇 Gold Medals | 🥈 Silver Medals | 🥉 Bronze Medals | Total Medals |
| 1 | USA | 55 | 42 | 42 | 139 |
| 2 | China | 34 | 22 | 24 | 80 |
| 3 | Great Britain | 26 | 21 | 20 | 67 |
| 4 | Russia | 22 | 19 | 25 | 66 |
| 5 | Germany | 20 | 18 | 21 | 59 |
| 6 | France | 12 | 17 | 17 | 46 |
| 7 | Japan | 12 | 11 | 18 | 41 |
| 8 | Australia | 11 | 15 | 14 | 40 |
| 9 | Italy | 11 | 12 | 11 | 34 |
| 10 | South Korea | 11 | 7 | 9 | 27 |
| 11 | Hungary | 9 | 5 | 6 | 20 |
| 12 | Netherlands | 8 | 7 | 7 | 22 |
| 13 | Spain | 6 | 7 | 5 | 18 |
| 14 | Cuba | 6 | 5 | 8 | 19 |
| 15 | Brazil | 5 | 5 | 7 | 17 |
| 16 | New Zealand | 5 | 5 | 5 | 15 |
| 17 | Kenya | 5 | 5 | 4 | 14 |
| 18 | Jamaica | 5 | 4 | 2 | 11 |
| 19 | Sweden | 4 | 7 | 5 | 16 |
| 20 | Canada | 4 | 6 | 13 | 23 |
| 21 | Ukraine | 4 | 5 | 7 | 16 |
| 22 | Romania | 4 | 4 | 4 | 12 |
| 23 | Poland | 3 | 4 | 7 | 14 |
| 24 | Kazakhstan | 3 | 4 | 7 | 14 |
| 25 | Czech Republic | 3 | 3 | 5 | 10 |
| 26 | Switzerland | 3 | 3 | 3 | 9 |
| 27 | Iran | 3 | 2 | 3 | 8 |
| 28 | Croatia | 3 | 2 | 2 | 7 |
| 29 | Denmark | 2 | 5 | 6 | 13 |
| 30 | Belarus | 2 | 4 | 5 | 11 |
| 31 | South Africa | 2 | 4 | 2 | 8 |
| 32 | Slovakia | 2 | 3 | 2 | 5 |
| 33 | Ethiopia | 2 | 2 | 4 | 8 |
| 34 | Norway | 2 | 2 | 3 | 7 |
| 35 | Georgia | 2 | 2 | 3 | 7 |
| 36 | Colombia | 2 | 2 | 3 | 7 |
| 37 | Turkey | 2 | 2 | 3 | 7 |
| 38 | Finnland | 2 | 2 | 3 | 7 |
| 39 | Greece | 2 | 2 | 2 | 6 |
| 40 | Nord Korea | 2 | 2 | 2 | 6 |
| 41 | Belgium | 2 | 2 | 2 | 6 |
| 42 | Thailand | 2 | 2 | 2 | 6 |
| 43 | Uzbekistan | 2 | 1 | 5 | 8 |
| 44 | Argentina | 2 | 1 | 2 | 5 |
| 45 | Azerbaijan | 1 | 4 | 7 | 12 |
| 46 | Mexico | 1 | 3 | 3 | 7 |
| 47 | Bulgary | 1 | 2 | 3 | 6 |
| 48 | Serbia | 1 | 2 | 2 | 5 |
| 49 | Slovenia | 1 | 2 | 2 | 5 |
| 50 | Indonesia | 1 | 2 | 1 | 4 |
| 51 | Lithuania | 1 | 1 | 3 | 5 |
| 52 | Chinese Taipeh | 1 | 0 | 2 | 3 |
| 53 | Tunisia | 1 | 0 | 2 | 3 |
| 54 | Bahamas | 1 | 0 | 1 | 2 |
| 55 | Bahrain | 1 | 0 | 0 | 1 |
| 56 | Armenia | 0 | 2 | 1 | 3 |
| 57 | Malaysia | 0 | 2 | 1 | 3 |
| 58 | India | 0 | 1 | 2 | 3 |
| 59 | Egypt | 0 | 1 | 2 | 3 |
| 60 | Austria | 0 | 1 | 1 | 2 |
| 61 | Ireland | 0 | 1 | 1 | 2 |
| 62 | Estonia | 0 | 1 | 1 | 2 |
| 63 | Venezuela | 0 | 1 | 1 | 2 |
| 64 | Mongolia | 0 | 1 | 1 | 2 |
| 65 | Portugal | 0 | 1 | 1 | 2 |
| 66 | Nigeria | 0 | 1 | 1 | 2 |
| 67 | Vietnam | 0 | 1 | 0 | 1 |
| 68 | Latvia | 0 | 1 | 0 | 1 |
| 69 | Algeria | 0 | 1 | 0 | 1 |
| 70 | Philippines | 0 | 1 | 0 | 1 |
| 71 | Trinidad and Tobago | 0 | 0 | 1 | 1 |
| 72 | Marocco | 0 | 0 | 1 | 1 |
| 73 | Israel | 0 | 0 | 1 | 1 |
| 74 | Katar | 0 | 0 | 1 | 1 |

Michi Wegmüller
Co-Founder – Empowering Agile Analytics at Scale
Michi Wegmüller is co-founder of Artifact SA and responsible of Artifact’s Analytics Garage offering. He has more than 15 years of experience in Data and Analytics consulting and has supported a diverse set of Swiss and international clients across industries. He has helped to realize analytics initiatives that are sustainably growing and continuously delivering value to the business and functional units. He is passioned about agile analytics at scale.
Artifact SA
Accelerating Impact with AI & Data Science
Spearheading in AI & Data Science to accelerate impact for your business in Switzerland. Pragmatic analytics services leader for consulting & implementation.
0 Comments